

 20 March, 2024


As India gets ready to vote in the general election, Balakrishnan and Parameswaran present a comprehensive, evidence-based review of the performance of the Indian economy over the past decade. In the first of a two-part series, they focus on macroeconomic indicators including growth, investment, unemployment, inflation, manufacturing performance, and tax revenues. In part II, they analyse indicators of well-being and investigate how the income distribution may have changed in this time.
When campaigning for his first term in office, Prime Minister Modi had stressed two aspects of the future economy of India. He asserted that “Achche din aanhe wale hai” (Better days are to come), followed with the maxim “Sabka saath, sabka vikas” (Development of all). Further, Modi affirmed an intention to deliver this with ‘minimum government and maximum governance’, signalling a commitment to the market. That he intended his term to be transformational was implied in the title chosen for the institution named to replace the Planning Commission, which had been in existence for over 60 years by then. The National Institute for the Transformation of India or NITI Aayog, was to serve as a governmental think tank on economic policy.
The picture of India encountered in the media and announcements made from time to time by the government, has been of an economy with growing infrastructure – including a digital public infrastructure enabling cashless payment as its centrepiece – tech unicorns, a buoyant stock market, luxury housing, and above all, high growth in a global comparison. The government itself has engaged in the narrative of a strong economy that has surpassed its past performance and one that benefits all sections of the population. Against this backdrop, we present an assessment of the economy during the past decade in terms of the standard indicators of economic performance.
Growth
As both the government and global observers have brought up the matter of growth in India, it would make sense to start there.
Annual growth since 2011
Figure 1 presents year-to-year changes in the growth of gross domestic product (GDP) in the last decade.
Figure 1. GDP growth, 2011-12 to 2023-24
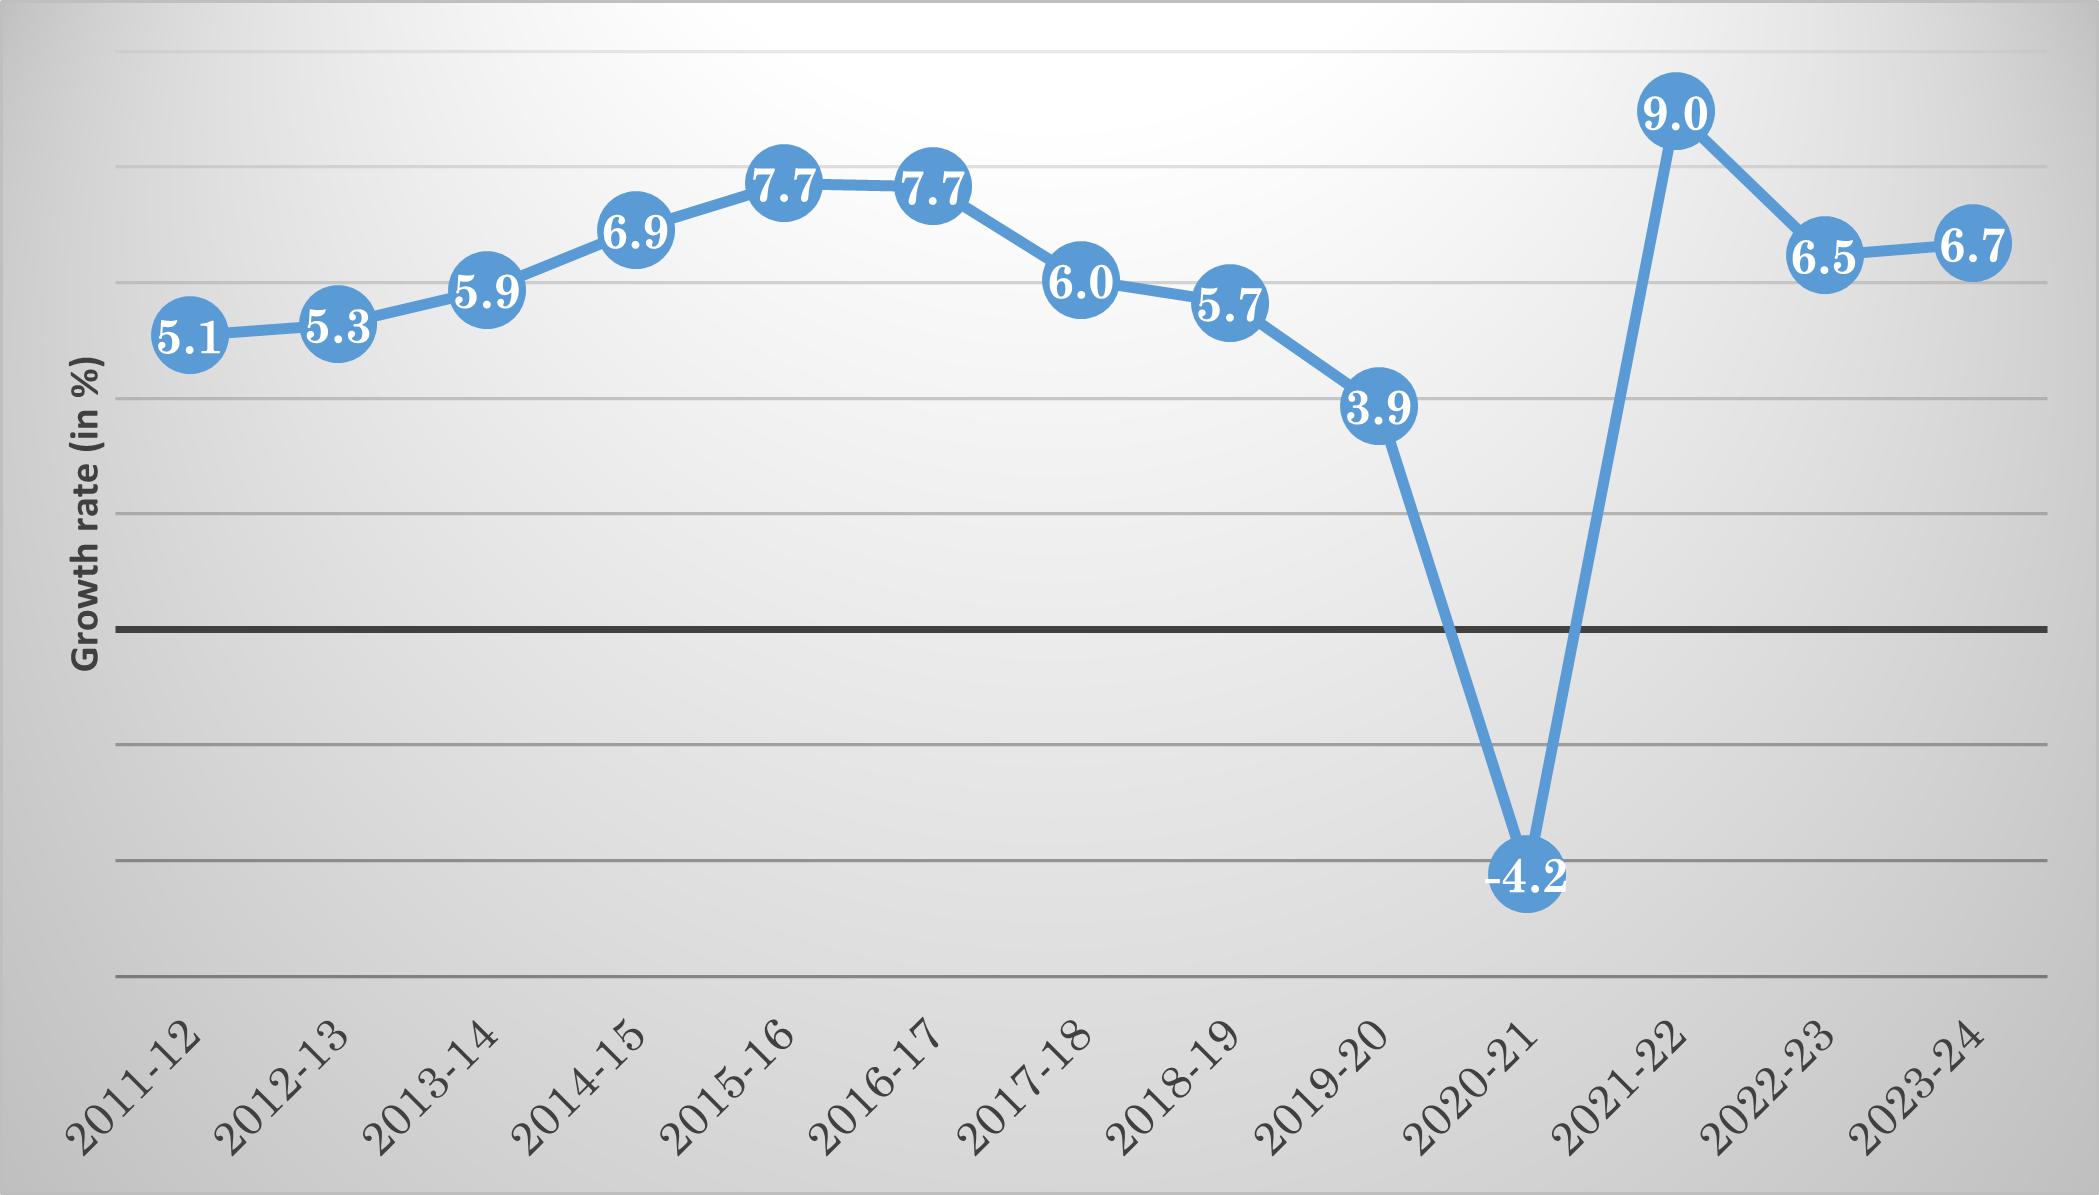
Note: Figures are of gross value added (GVA) at basic prices, in constant (2011-12) prices
Source: Data released periodically by the Ministry of Statistics and Programme Implementation. GVA for 2021-22 is the second revised estimate; for 2022-23 it is the first revised estimate; and for 2023-24 it is the second advanced estimate.
Three observations may be made on the data: (i) While the Modi government had inherited an accelerating economy, the momentum was lost within two years (by 2016-17); (ii) As no contemporaneous shift in factors such as agricultural growth, public investment or global demand is noticeable, there is reason to believe that it was the demonetisation of November 2016 that slowed the economy1; and (iii) The growth rate slowed continuously for three years after 2016-17, recovering sharply only post-Covid-19. We bring some perspective to this phase below.
The trend and the cycle
High-frequency growth data include cyclical fluctuations and hence do not throw light on the long-term growth path of the economy. The trend itself can shift over time. To allow for this we have identified the phases of growth over the past 75 years econometrically, with a view to placing the growth record of the Modi government in perspective2 (Figure 2 below). While growth had been rising over the previous decades, a deceleration in the rate of growth is seen from 2016-17.
Figure 2. Growth regimes, 1950-51 to 2023-24
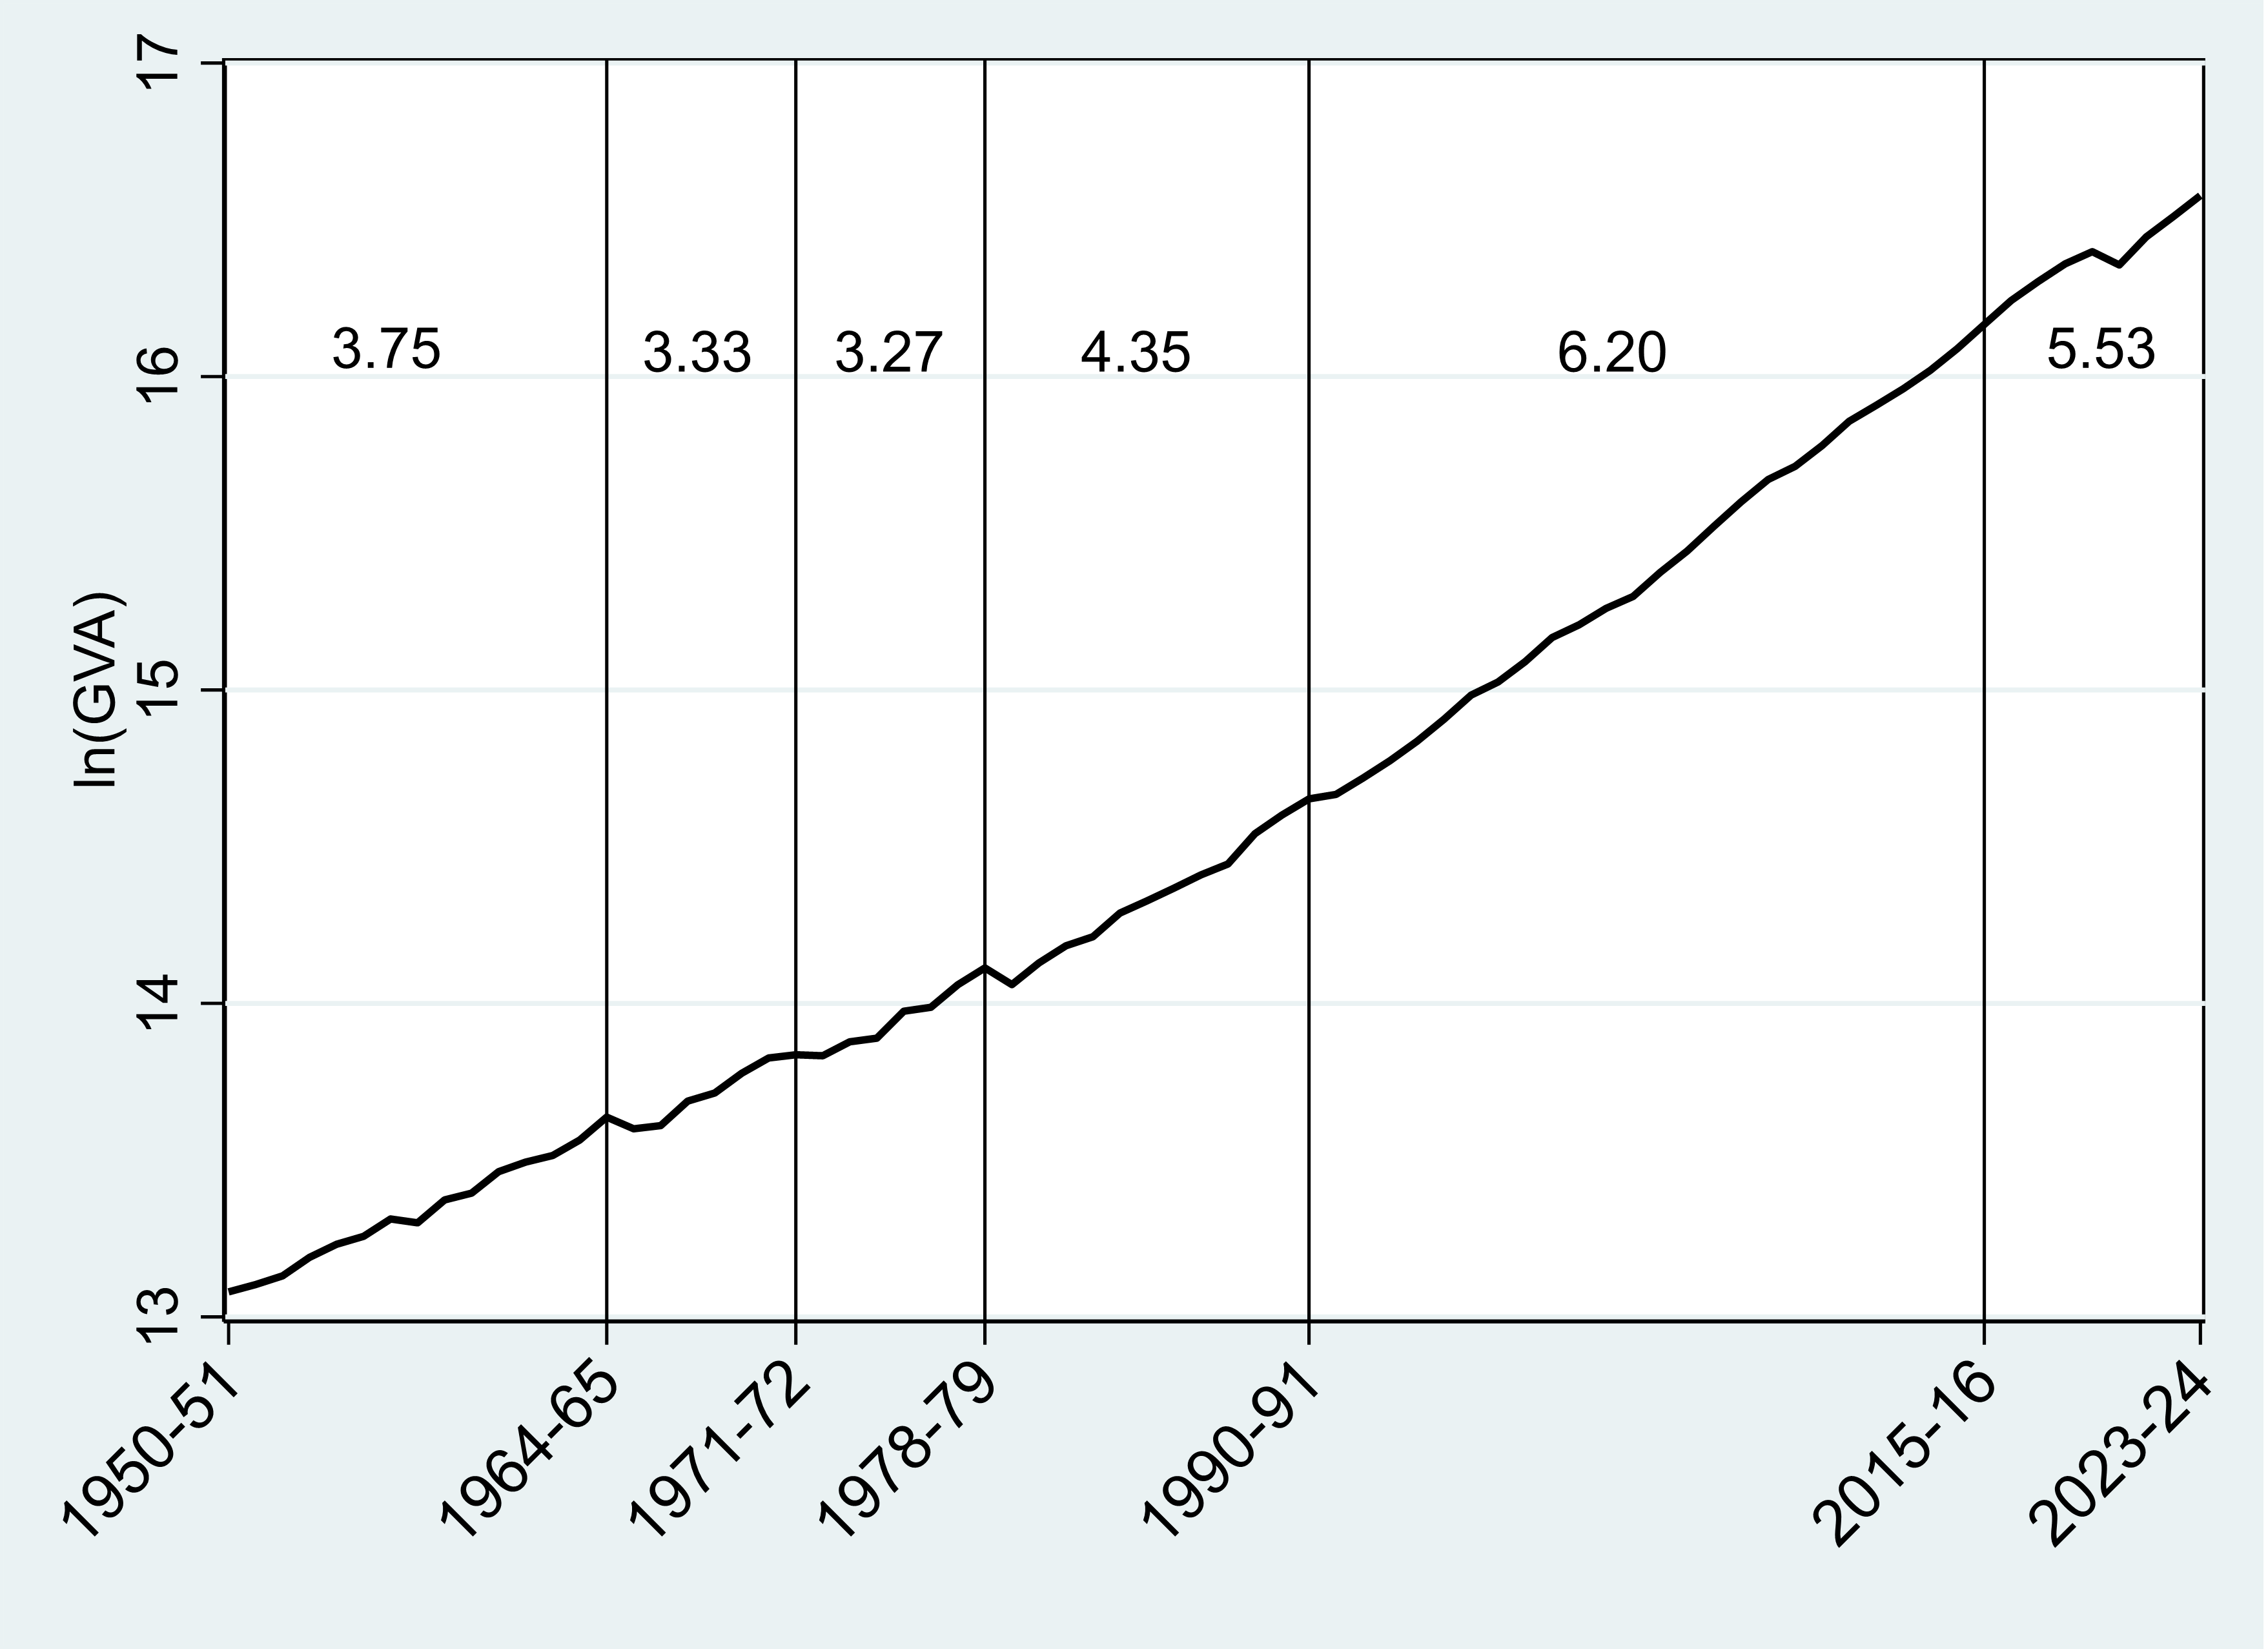
Notes: i) The graph plots annual GVA at basic prices. ii) The estimated ‘break dates’ are represented by the vertical lines partitioning the dataset into growth phases. A break date is the last year of a growth phase. iii) The figure appearing within a partition is the growth rate for that period.
Source: Data released periodically by the Ministry of Statistics and Programme Implementation.
Current growth and the recovery of the economy from Covid-19
In early 2024, the rate of growth of the economy is impressively high, leading to the repeated statement from the government that India is the world’s fastest growing major economy. However, this may well be a reflection of the bounce-back from the contraction during the pandemic, when in 2020-21 India had contracted to the greatest extent among the major economies of the world. We adopted two methods to ascertain this.
First, we estimate India’s GDP in 2022-23 and 2023-24 by extending the trend growth rate of 5.5% attained over 2016-17 to 2023-24. Accordingly, we find that actual GDP in 2022-23 was 2.5% lower than the predicted GDP; in 2023-24 it was 1.3% lower. In the second method, we extrapolate the GDP series up to 2023-24 using its growth rate in 2019-20 (the year preceding the pandemic), which is 3.9%. This is based on the assumption that the economy would have continued to grow at this rate for the next four years. The exercise reveals that actual GDP in 2022-23 is 0.4% less than the extrapolated value and in 2023-24 the actual was higher by 2.4 percent.
Investment
How plausible is the finding that the trend growth rate has not accelerated since 2014? After all, India’s economy has grown in size, from being the 11th largest in the world in 2014 to being the fifth largest today. At the same time, the results presented here point to a slowing growth rate in India in the past decade. A glance at the associated macroeconomic data would show that this finding need not come as a surprise. We refer to the data on the investment rate (Table 1) – compared to the level in 2013-14, the investment rate has been lower in every year since 2014. In fact, a decline set in after it peaked at 34.3% in 2011-12. So, while the slide had commenced well before 2014, the present government has not been able to turn the clock back.
To assess the plausibility of our finding we take a cue from early growth theory. In Harrod, for instance, the rate of growth of the economy is driven by its investment rate, given the incremental productivity of capital. In India, the investment rate has not increased over the past decade. Table 1 shows conclusively that corporate investment, in particular, has not been stimulated, despite a significant reduction in the corporate tax rate in 2019. Keynes (1936) had asserted that investors base their decision on long-term expectations. From such a perspective, it appears that investors have not felt convinced of the expansionary impacts of India’s current economic policy.
Table 1. Investment: Gross Fixed Capital Formation/GDP (at 2011-12 prices)
|
|
2013-14 |
2014-15 |
2015-16 |
2016-17 |
2017-18 |
2018-19 |
2019-20 |
2020-21 |
2021-22 |
|
Public/GDP |
7.3 |
7.3 |
8.0 |
7.6 |
7.3 |
7.6 |
7.7 |
7.4 |
7.4 |
|
Private/GDP |
25.3 |
23.9 |
22.7 |
23.2 |
23.7 |
24.3 |
24.8 |
23.4 |
23.4 |
|
Corporate/GDP |
12.6 |
11.5 |
12.7 |
12.0 |
11.3 |
11.4 |
11.9 |
11.8 |
11.8 |
|
Household/GDP |
12.6 |
12.3 |
10.0 |
11.2 |
12.4 |
12.9 |
12.9 |
11.6 |
11.6 |
|
GFCF/GDP |
32.6 |
31.2 |
30.7 |
30.8 |
31.0 |
31.9 |
32.5 |
30.8 |
30.8 |
Source: Author’s calculation from estimates of National Income, Consumption Expenditure, Saving and Capital Formation.
Unemployment
The rate of unemployment is a standard criterion by which the performance of an economy is assessed. The unemployment rate (UR) assumes particular significance in the context of this investigation. Table 2 presents data on the UR and the proportion of the population that is in employment (the worker-population ratio, or WPR). The UR rose very substantially during 2014-2019, peaking in 2017-18 – the year following the demonetisation. Since then, the rate has declined steadily – somewhat surprisingly even during the pandemic. On average, UR has been higher in the past decade, as compared to data that are available for the years immediately prior to it. The WPR has risen since 2017-18 but is not, on average, higher than it was in the years prior to 2014. Neither has the UR fallen below the earlier trough, nor has the WPR exceeded the previous peak, though it has come close to it3. The conclusion to be drawn from this is that no dent has been made on the unemployment situation in the past decade.
Table 2. Employment and unemployment, 2004-05 to 2022-23
|
|
UR (%) |
WPR (%) |
|
2004-05 |
2.8 |
39.2 |
|
2009-10 |
2.4 |
42 |
|
2011-12 |
2.4 |
38.6 |
|
2017-18 |
6.1 |
34.7 |
|
2018-19 |
5.8 |
35.3 |
|
2019-20 |
4.8 |
38.2 |
|
2020-21 |
4.2 |
39.8 |
|
2021-22 |
4.1 |
39.6 |
|
2022-23 |
3.2 |
41.1 |
Note: A continuous data series on both UR and WPR is available only from 2017-18 onwards. Data are for usual (employment) status.
Source: WPR is from the Periodic Labour Force Survey (PLFS) for 2017-18. UR for the years up to 2017-18 is calculated from data in PLFS (2017-18). For later years it is taken from subsequent annual issues of the PLFS.
Inflation
Inflation declined substantially in the first half of the past decade, only to flare up again in the second half (Table 3). The latter trend commenced even before the emergence of Covid-19 and the Ukraine War – both of which disrupted global supply chains – implying that domestic factors must be at play. India’s recent experience with inflation casts some light on the efficacy of inflation targeting, a policy adopted by the Reserve Bank of India (RBI), following an amendment of the RBI Act (1934) by parliament, in 2016. Note that for most part of the past decade, the inflation rate has been above the target of 4%, though within what has been quite arbitrarily set as a ‘range of tolerance’ extending to 2 percentage points beyond target in both directions. This, and the more recent flaring of inflation, is not surprising at all as the tools of a central bank committed to inflation targeting do not extend to the control of agricultural price movements. This is a weakness in India’s inflation control strategy, as food prices constitute a significant part of the cost of living. As seen in Table 3, the flaring of inflation rates since 2019-20 has been driven by a huge upward shift in the contribution of food prices.
Table 3. Inflation rates and the contribution of food prices, 2012-13 to 2022-23
|
Year |
Inflation rate (%) |
Contribution of food (%) |
|
2012-13 |
9.4 |
51.8 |
|
2013-14 |
9.0 |
57.3 |
|
2014-15 |
5.8 |
50.0 |
|
2015-16 |
4.8 |
47.2 |
|
2016-17 |
4.4 |
51.5 |
|
2017-18 |
3.5 |
17.2 |
|
2018-19 |
3.4 |
4.7 |
|
2019-20 |
4.7 |
52.7 |
|
2020-21 |
6.0 |
53.9 |
|
2021-22 |
5.4 |
35.3 |
|
2022-23 |
6.4 |
46.2 |
Source: Authors’ calculation from data published by the Ministry of Statistics and Programme Implementation.
‘Make in India’
‘Make in India’ has been a flagship programme of the Modi government4. At the time of its launch in 2014, it had two principal goals: to create 100 million additional jobs in manufacturing and to raise the sector’s contribution to 25% of GDP. A strategic element of the programme was to invite global corporations to manufacture in India – a form of foreign direct investment.
Figure 3 below shows that Make in India has had very little success in raising the rate of growth of manufacturing. In fact, testing the growth rate of manufacturing shows it to be one of the sectors of the economy that witnessed a decline in its rate of growth since 2016. The share of manufacturing in GDP has not changed, implying that the sector has not grown any faster than the rest of the economy5 The graph shows a sharp reduction in the rate of growth in 2016-17. Once again, given that there was no other negative shock to output in that year it would be difficult to escape the conclusion that the reduction in the growth rate of manufacturing – a sector that had actually exhibited accelerating growth for a couple of years prior – had been caused by the demonetisation. In fact, the one noticeable shock, that of agricultural growth, was highly positive. Had agriculture not performed exceptionally well that year, the manufacturing contraction may have been even greater in 2016-17.
Figure 3. ’Growth of manufacturing and agriculture after ‘Make in India’
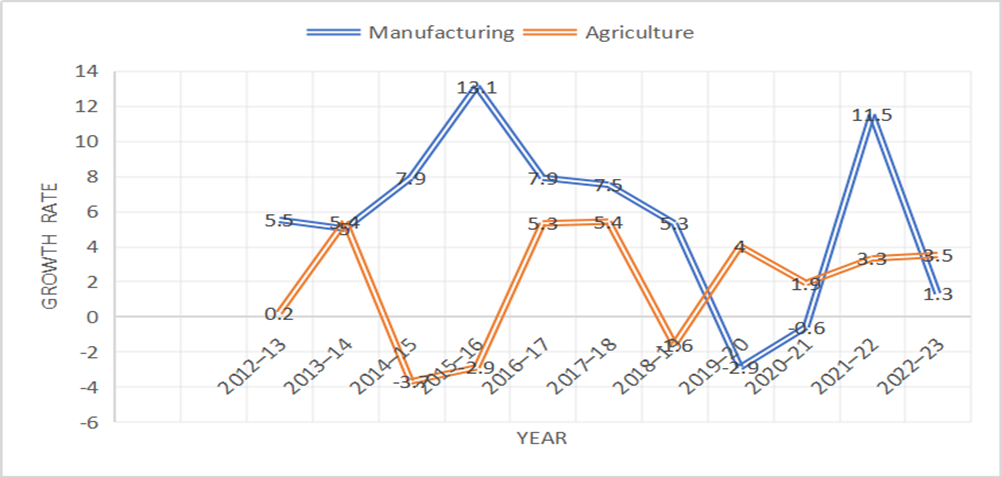
Notes: i) Figures depict the annual growth rate. ii) Data for agriculture refers to production for years up to 2020-21.
Source: Calculated from estimates of gross value added by sector published periodically by the National Statistical Office.
GST and resource mobilisation
A nation-wide goods and services tax (GST) was introduced in India in 2017. Apart from the convenience of removing barriers to the movement of goods across states – each of which earlier had its own indirect tax regime – GST has virtue in being a value-added tax in a way that the erstwhile sales taxes of the individual states were not. However, apart from its technical merits, it was also projected to be a measure with the potential to mobilise resources.
Table 4 depicts tax revenues post-GST, normalised by GDP. Indirect tax revenues as a share of GDP have not been higher in any year after 2017-18. Nothing like the anticipated surge in revenues has taken played out, relative to the growth of the economy. Notably, direct taxes, which were not subject to the reform associated with the introduction of GST, seem to have performed better. Whether this is due to a spillover effect from the surveillance, enabled by the introduction of GST, leading to better compliance or a shifting distribution of income, cannot be said with certainty given the data at hand. However, while much has been made of the fact that the direct tax-to-GDP ratio in 2023 is higher than it was in 2013, it is still lower than the level attained in 2007-08. Overall, the tax record in the past decade shows only slight improvement compared to preceding years, and next to none after the tax reforms.
Table 4. Resource mobilisation from tax revenue
|
Year |
Direct taxes/GDP |
Indirect taxes/GDP |
Tax-to-GDP ratio |
|
2013-14 |
5.6 |
4.4 |
10.1 |
|
2014-15 |
5.5 |
4.4 |
10.0 |
|
2015-16 |
5.4 |
5.2 |
10.6 |
|
2016-17 |
5.5 |
5.6 |
11.2 |
|
2017-18 |
5.9 |
5.3 |
11.2 |
|
2018-19 |
6.0 |
4.9 |
10.9 |
|
2019-20 |
5.1 |
4.7 |
9.8 |
|
2020-21 |
4.8 |
5.5 |
10.3 |
|
2021-22 |
6.0 |
5.4 |
11.4 |
|
2022-23 |
6.0 |
5.1 |
11.1 |
Source: Ministry of Finance, Government of India (2024).
We thank Mausumi Das, M. Suresh Babu and K.J. James for discussions, and the I4I Editor-in-Chief for helpful comments. Errors and omissions if any would be ours.
The views expressed in this post are solely those of the author, and do not necessarily reflect those of the I4I Editorial Board.
The second part of this series is available here.
Notes:
- For econometric evidence of the impact of the demonetisation on output and employment see Chodorow-Reich et al. (2019).
- Growth phases were identified using the Bai-Perron procedure with the minimum length of a phase set at six years. See Bai and Perron (1998) for more details on the methodology.
- For an authoritative disputation on the methodology of classifying the unemployed in the Periodic Labour Force Survey (PLFS) and the claim of job creation in recent years see this interview with Santosh Mehrotra.
- Although it bears close resemblance to the programme launched by the United Progressive Alliance (UPA) in 2011 named ‘National Manufacturing Policy’.
- See Balakrishnan (2022) for the evidence and an explanation
Further Reading
- Bai, Jushan and Pierre Perron (1998), “Estimating and Testing Linear Models with Multiple Structural Changes”, Econometrica, 66(1): 47-78. Available here.
- Balakrishnan, P. (2022), India’s Economy from Nehru to Modi: A Brief History.
- Balakrishnan, P and M Parameswaran (forthcoming), ‘Economic Growth in India, A longer view’, in Krishna, KL, B Goldar and D Maity (eds.), Growth, Development and Productivity: 75 years of Indian experience, Springer Verlag.
- Chodorow-Reich, Gabriel, Gita Gopinath, Prachi Mishra and Abhinav Narayanan, (2019), “Cash and the Economy: Evidence from India's Demonetization”, The Quarterly Journal of Economics, 135(1): 57-103.
- Harrod, R.F. (1939), “An Essay in Dynamic Theory”, The Economic Journal, 49(193): 14-33.
- Keynes, JM (1936), The General Theory of Employment, Interest and Money, Harcourt, Brace and Jovanovich, London.

Comments will be held for moderation. Your contact information will not be made public.